Tracking the 2026 Cyclospora Outbreak in Near Real Time

Written by: Alina Bogdanov, MA, Director of Programming Analytics, Real World Evidence, Veradigm, and Katherine Cappell, PhD, Director of Research Analytics, Real World Evidence, Veradigm
What the national headlines are reporting, what five years of real-world data show about a typical summer, and how near-real-time EHR and claims feeds let us watch this season as it unfolds.
Cyclosporiasis, an intestinal illness caused by the parasite Cyclospora cayetanensis, keeps a fairly predictable calendar in the United States. Cases climb in May, peak in the heart of summer, and fade by the end of August, tracking the months when fresh produce is most abundant on American plates. This year, the seasonal rise has drawn enough national attention that the coverage is calling it a cyclospora outbreak, and it keeps circling the same question: is this a single connected outbreak, or a louder version of the normal summer pattern?
That question is exactly what real-world data is built to answer. Public case counts take weeks to settle, which makes it hard to separate signal from seasonal noise in the moment. Working from near-real-time EHR and claims feeds, our Real-World Evidence team has been watching the 2026 season against five years of our own baseline, and the early read is striking.
What the 2026 cyclospora outbreak looks like so far
As of mid-July 2026, the CDC had logged more than 1,600 confirmed domestically acquired cases across at least 34 states, with several jurisdictions reporting sharp increases over the same period last year. Michigan has been hit hardest by a wide margin, its case counts running many times above a typical annual total. State investigators there have pointed to leafy greens as a recurring theme in patient interviews, though no specific grower, supplier, or product has been confirmed as the source. It is worth being precise about what is, and isn’t, confirmed. The CDC says it is investigating a multistate outbreak, but its national tally also includes clusters still under traceback investigation and cases not yet linked to any common source. So part of the season now making headlines is a recognized outbreak, and part may be separate regional clusters, or simply a more intense version of the usual summer pattern. The ambiguity is a useful reminder. Even with modern lab and epidemiological tools, telling an outbreak apart from seasonal variation in the moment is genuinely difficult, and the CDC assumes roughly a six-week lag between when people fall ill and when their cases reach its counts.
What five years of our data show
That is precisely the kind of question longitudinal data is built to answer. Using our Veradigm Network EHR (VNEHR) and Payerpath datasets, we pulled monthly cyclosporiasis activity (ICD-10 A07.4 or SNOMED 240372001) from 2021 through 2025 to establish a baseline for what a typical season looks like.
Methodology. Numerator: patients with a cyclosporiasis claim, or a diagnosis of the ICD-10 or SNOMED code entered in the EHR, in a given month. Denominator: all patients with any claim or any diagnosis entered in that same month.
Note: patients are de-duplicated across sources, so a patient with both a claim and an EHR diagnosis in the same month is counted once, not twice.
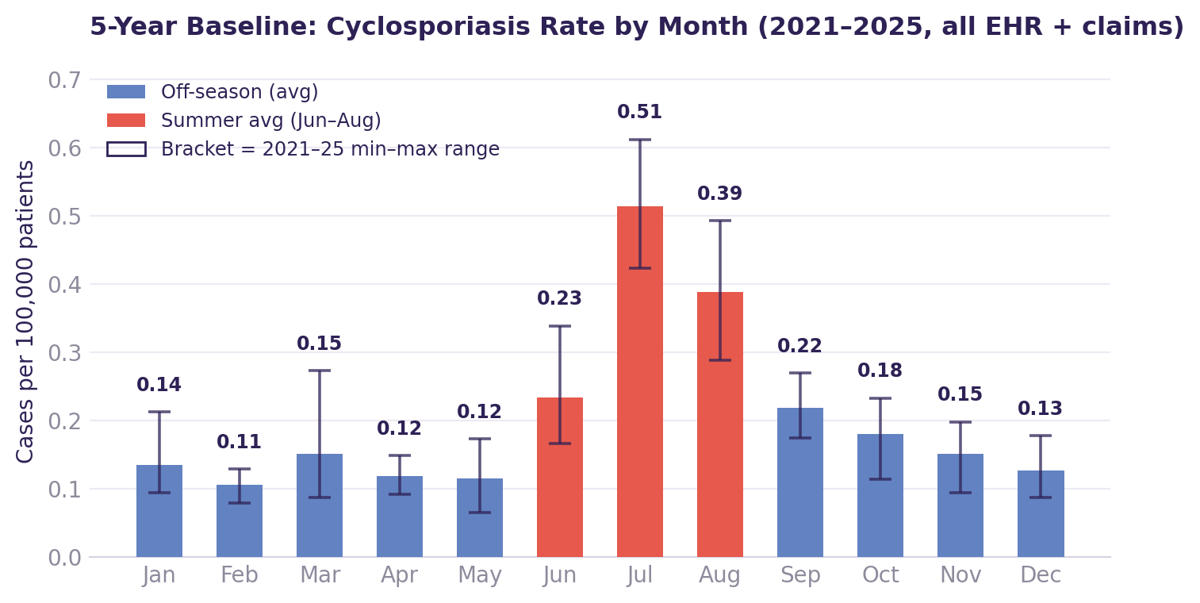
Average monthly rate per 100,000 patients, all EHR and claims sources, 2021–2025. Brackets show the min-to-max range across those five years.
Rates hold steady through the off-season, then climb sharply each summer and peak in July, roughly 2.5x the annual average. That peak is the baseline we measure 2026 against.
Watching 2026 as it happens
Public health surveillance is, by necessity, retrospective. Cases have to be diagnosed, reported, and aggregated before anyone can see the full picture, which is the source of the multi-week lag noted above. Our data pipeline is built differently, with fast native refreshes, which let us track this season with far less delay than traditional reporting channels allow.
To keep our 2026 view current, we focused this part of the analysis on two rapidly refreshing sources comprising roughly 45% of our patient volume in a typical mature month, more than enough to give an early, representative read on a season before slower sources have finished reporting.
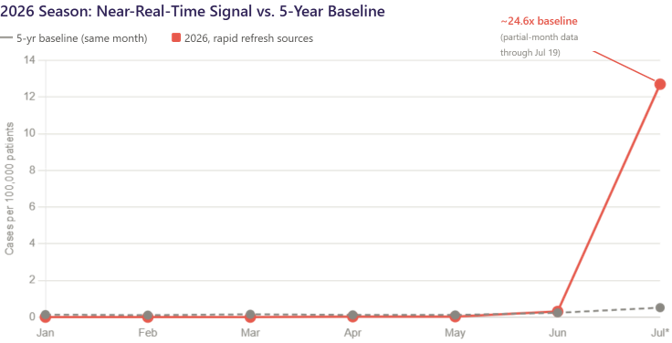
2026 monthly rate per 100,000 patients, rapid refresh sources, against the 2021–2025 baseline for each calendar month.
January through April 2026 tracked close to baseline, consistent with a normal off-season. June showed a modest uptick, 0.30 against a 0.23 baseline, nothing alarming on its own. July is a different story. Through the data available so far this month (activity through July 19), the rate sits at 12.7 per 100,000, roughly 24.6x the five-year July baseline. July is still a partial month, so that figure will keep moving as more data comes in.
A closer look at cyclospora in Michigan
Geographically, the cyclospora concentration is stark: roughly 81% of our July 2026 cases are in Michigan, consistent with what state and federal officials have reported publicly. That is a remarkable level of concentration by historical standards. Across the same summer window (June through August) for 2021 through 2025 in our data, the single most-affected state in a given year accounted for just 12–23% of cases, averaging about 17%, and the top two states combined accounted for 24–33%, averaging about 28%. Michigan’s 81% share this July runs roughly 4.9x the typical top-state share and about 2.9x the typical combined share of the top two states, well outside anything we have seen in the prior five summers.
What near-real-time data makes possible
There is a second reason this season is worth watching closely. As of July 1, 2025, FoodNet, the CDC surveillance network run with the USDA, FDA, and 10 state health departments, made routine reporting optional for six of the eight pathogens it had long tracked, cyclospora among them. National surveillance for the parasite did not end, but a core layer of routine monitoring became discretionary just before this year’s surge. That is exactly the kind of gap timely, real-world data can help close. This is exactly the scenario near-real-time data is built for. National reporting is still working to confirm the shape of the season, one connected outbreak or several separate events, and full claims data for June and July will not mature in most sources for another one to two months. Our internal pipeline already shows a clear, meaningful elevation in July, grounded in a five-year baseline rather than a single prior year or a national headline.
That is the practical payoff of fast-refreshing data: earlier signal, clearer context, and more confidence in the numbers we bring to clients and stakeholders, well before the rest of the industry catches up. It is also the foundation of Veradigm’s Life Sciences work. The same VNEHR real-world data and real-world evidence services that power this analysis help life sciences teams monitor safety and efficacy, study treatment patterns, and answer emerging questions while they still matter.
We will keep tracking the 2026 cyclospora outbreak through the rest of the season. To learn how Veradigm’s real-world data and evidence solutions can support your team, contact us.