What Can Skin Tell Us About Diabetic Retinopathy?
Skin changes are easy to overlook during a routine diabetes visit. A team of students and faculty at the California University of Science and Medicine (CUSM) School of Medicine asked if one of those changes could point to something happening in the eye, a question that matters for diabetic retinopathy prevention. To find out, they turned to de-identified electronic health record (EHR) data from the Veradigm Network, provided through the Veradigm University Data Grant Program.
About the Veradigm University Data Grant Program
The program gives academic researchers free access to de-identified Veradigm Network EHR data. Faculty, graduate researchers, students, non-profit research centers, and academic institutions can apply for a one-time cohort delivery, with up to 10 years of history. Each grant covers EHR data only. It does not include enriched NLP, social determinants of health (SDOH), or mortality data.
The goal is simple. Researchers shouldn’t need a commercial budget to study how care happens across thousands of independent practices. With the right real-world data, a small team can test a clinical question that would otherwise stay on a whiteboard.
The CUSM team did exactly that. Below, they share what they found when they looked for a link between a common skin condition and diabetic retinopathy.
Diabetic retinopathy stages and why timing matters
Diabetic retinopathy progresses slowly, and many people notice nothing in the early stages. It begins as nonproliferative diabetic retinopathy (NPDR), which is classified as mild, moderate, or severe. It can then advance to proliferative diabetic retinopathy (PDR), when abnormal new blood vessels grow on the retina.
Understanding diabetic retinopathy stages helps explain why early detection matters. The earlier stages offer the best window to act, so prevention depends on spotting change before vision is affected. A reliable early marker that clinicians can see during a routine exam could help them decide who needs closer monitoring sooner. That’s the question the CUSM team set out to test.
What can skin tell us about diabetic retinopathy?
Written by: Ryan Vigilia and Stella Yao (equal contribution), Arron Kim, Sean Kim, Christian Mark Antonio, and Jun Ling
California University of Science and Medicine, School of Medicine
Beyond blood sugar: what patient records reveal about diabetes
Type 2 diabetes mellitus (T2DM) affects far more than just blood sugar. Over time, chronic metabolic and vascular changes can damage tissues throughout the body, producing complications involving the kidneys, nerves, eyes, and even the skin. An up-to-date record of clinical manifestations and disease progression could go a long way toward improving patient outcomes.
Near-real-time EHR data provide timely access to patient information, allowing clinicians and researchers to identify changes in patient status, healthcare utilization, and clinical outcomes with minimal delay. Compared with traditional retrospective datasets, near-real-time EHRs can support earlier recognition of emerging trends, facilitate more responsive clinical decision-making, and improve the ability to monitor patient care throughout an encounter. This timeliness may be particularly valuable in healthcare settings where patient volume, acuity, and resource needs can change rapidly. For research, these data can provide a more detailed and temporally accurate representation of clinical events, enabling investigators to evaluate patterns of care, resource utilization, and patient outcomes as they occur.
The biochemical and pathophysiological pathways suggest a close connection between two vascular complications of T2DM: diabetic dermopathy (DD), a common skin condition, and diabetic retinopathy (DR), damage to the blood vessels of the retina. Real-world data offers a foundational base for observing how these manifestations unfold. The Veradigm EHR offers tangible data from a multitude of providers, tracking patients throughout their healthcare journey.
The science behind the skin-eye connection
Chronic hyperglycemia due to T2DM promotes the accumulation of advanced glycation end products (AGEs) and reactive oxygen species (ROS). These impair key cellular pathways, such as the diacylglycerol (DAG)-protein kinase C (PKC) pathway. The overproduction of AGEs and the activation of PKC isoforms, such as PKC-β2 and PKC-δ, have been associated with increased endothelial dysfunction, oxidative stress, inflammation, basement membrane thickening, abnormal angiogenesis, and vascular permeability via VEGF expression.
The exact pathogenesis of DD remains unclear. Current evidence suggests a multifactorial mechanism that involves impaired wound healing, abnormal scar formation, extravasated erythrocytes, and hyaline microangiopathy within the dermal blood vessels. Additionally, the time elapsed since DD diagnosis is associated with the severity of future microvascular complications.
In DR, AGEs accumulate in retinal vascular endothelial cells and cause oxidative stress. This leads to inflammation, vascular degeneration, and capillary dilation. Ultimately, it results in neovascularization and neurodegeneration in the retina. Hyperglycemia has also been shown to contribute to pericyte loss, resulting in capillary microaneurysms and decreased blood perfusion. The combination of ROS and AGEs disrupts the blood-retinal barrier (BRB), allowing blood and fluid to leak into the retina and leading to visual impairment.
These shared pathophysiological mechanisms suggest that DD may reflect microangiopathic changes that occur concomitantly in the retina. A study that identifies substantial associations among DD, DR, and diabetic neuropathy across multiple clinical domains (e.g., DD lesion burden, diabetes duration, age) supports this idea. Similarly, diabetes duration is positively associated with the onset of DR and DD.
Because DD shares the same inflammatory pathway with DR and can be visually identified during a routine physical examination, DD may have predictive value as an early clinical indicator of DR. Thus, in this study, we focused on patient data with clinical determinants to evaluate the relationship between DD and DR. We also wanted to determine if DD can serve as a practical clinical marker for early screening and preventive management of DR and other neurovascular complications in patients with T2DM.
Putting the theory to the test: what we looked for in patient records
Using the Veradigm Network EHR, we compiled data from patients diagnosed with various ICD-10 codes to establish if there was a concrete association between DD and DR. We also looked at extraneous variables that may contribute to their severity and progression timeline.
Methodology: Patient data were obtained retrospectively from the Veradigm Network database by filtering on ICD codes. The database provided detailed clinical records (e.g., demographics, provider visits, diagnoses) for patients diagnosed with T2DM, DR, and DD.
Note: For patients diagnosed with both DD and DR, patient visits were sorted chronologically to determine the populations diagnosed with DD or DR first, along with their age information at diagnosis. However, patients diagnosed with both DD and DR at the same visit were excluded due to the focus on the progression of DD or DR. Furthermore, because gender analyses were conducted, patients who did not report their gender were excluded.
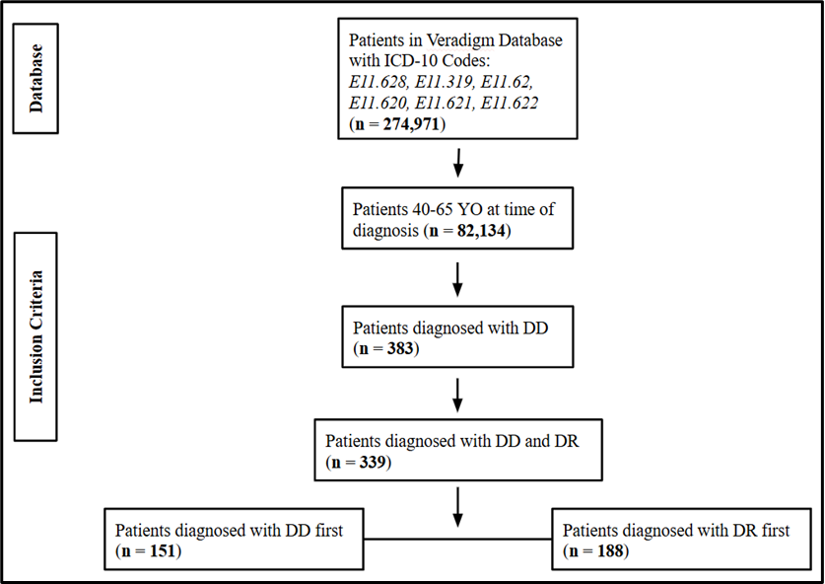 Figure 1. Scheme for data collection using the Veradigm database with patient inclusion criteria.
Does DD come before DR?
Looking at the full cohort of 383 patients with an initial DD diagnosis, only 87 patients (22.7%) received a DR diagnosis within the following year. The majority, 296 patients (77.3%), either developed DR more than a year later or did not have DR documented during follow-up at all. This trend persisted within genders, age groupings, and their interaction. These results suggest that additional factors may contribute to a DR diagnosis after an initial DD diagnosis.
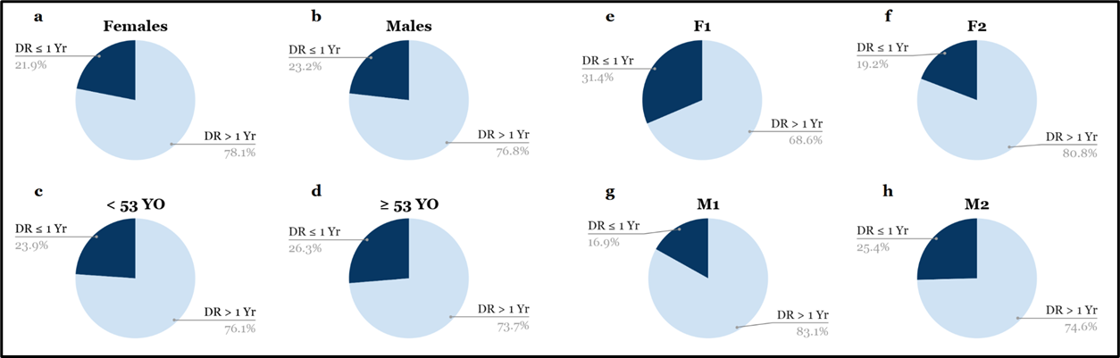 Figure 2. Progression to DR within one year of DD diagnosis. F1 = females younger than 53 years, F2 = females 53 years or older, M1 = males younger than 53 years, M2 = males 53 years or older.
So which condition appeared first?
We then examined a smaller cohort of 339 patients who were diagnosed with both DD and DR during separate clinical encounters to see which condition tended to appear first. Of these patients, 151 (44.5%) were diagnosed with DD first (DDF) and 188 (55.5%) were initially diagnosed with DR (DRF). A similar pattern was seen within genders, age groupings, and their interaction. However, statistical testing did not confirm these differences.
Interestingly, this pattern did not definitively indicate that DD preceded DR immediately. Rather, when looking at the time between the two diagnoses, patients diagnosed with DRF had a longer average interval between diagnoses than DDF (1.4 years and 1.1 years, respectively). While this trend persisted within genders, age groupings, and their interaction, these findings were only statistically significant among males.
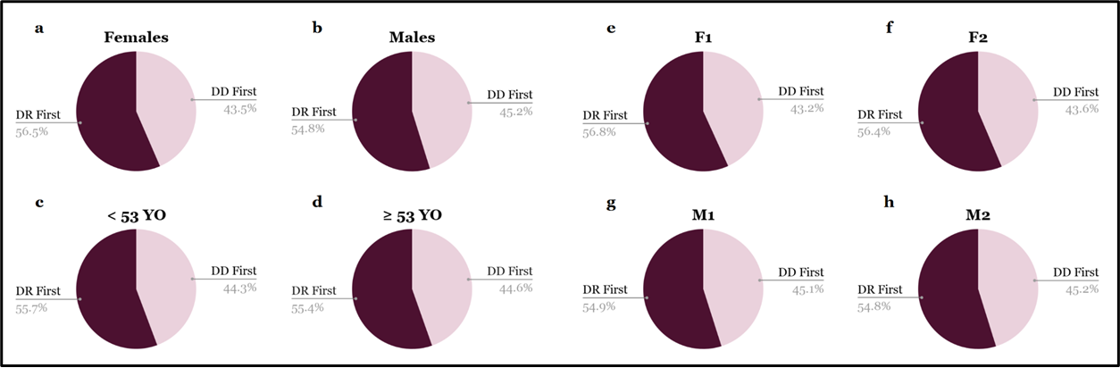 Figure 3. Diagnosis presentation between gender, age, and their intersectionality. F1 = females younger than 53 years, F2 = females 53 years or older, M1 = males younger than 53 years, M2 = males 53 years or older.
What does this mean?
Our findings suggest that while DD and DR may occur in a related chronological sequence for some patients, this relationship is not definitively defined. In 44.5% of patients with separate DD and DR encounters, DD was diagnosed first. However, the interval between diagnoses was actually longer among those diagnosed with DRF. Furthermore, retrospective analyses indicated that gender, age grouping, and their interaction did not substantially alter these general findings.
Future studies should include larger patient cohorts, broader age ranges, and additional molecular pathways linking DD and DR. Uncovering the DD-DR relationship could help clinicians anticipate retinal involvement earlier, prompt more proactive monitoring, enable more timely intervention, and improve outcomes for patients with T2DM.
What an expansive, diverse EHR makes possible
To identify the best moment for physicians to intervene, we must track patients’ progression through the various stages and manifestations of T2DM. This kind of study requires both retrospective and longitudinal data, which is difficult to compile without the help of a large EHR database such as Veradigm. The Veradigm real-world database allows us to filter patients using ICD-10 codes, age of onset, duration of diagnosis, and confounding factors that may contribute to severity and prognosis. The need for further research into more specific aspects of DD and DR remains.
Bring your own research question
Faculty, graduate researchers, and students working on diabetic retinopathy prevention or any other clinical question can learn more about the Veradigm University Data Grant Program and apply for access. To learn how Veradigm’s real-world data and evidence solutions can support your team, contact us.